
Project information
- Name: Podgorica Urban Area Expansion
- Creation date: 12th January, 2025
- Software: ArcGIS Pro, PostGIS
- Source: Esri, OCHA, OSM, Copernicus Land Cover
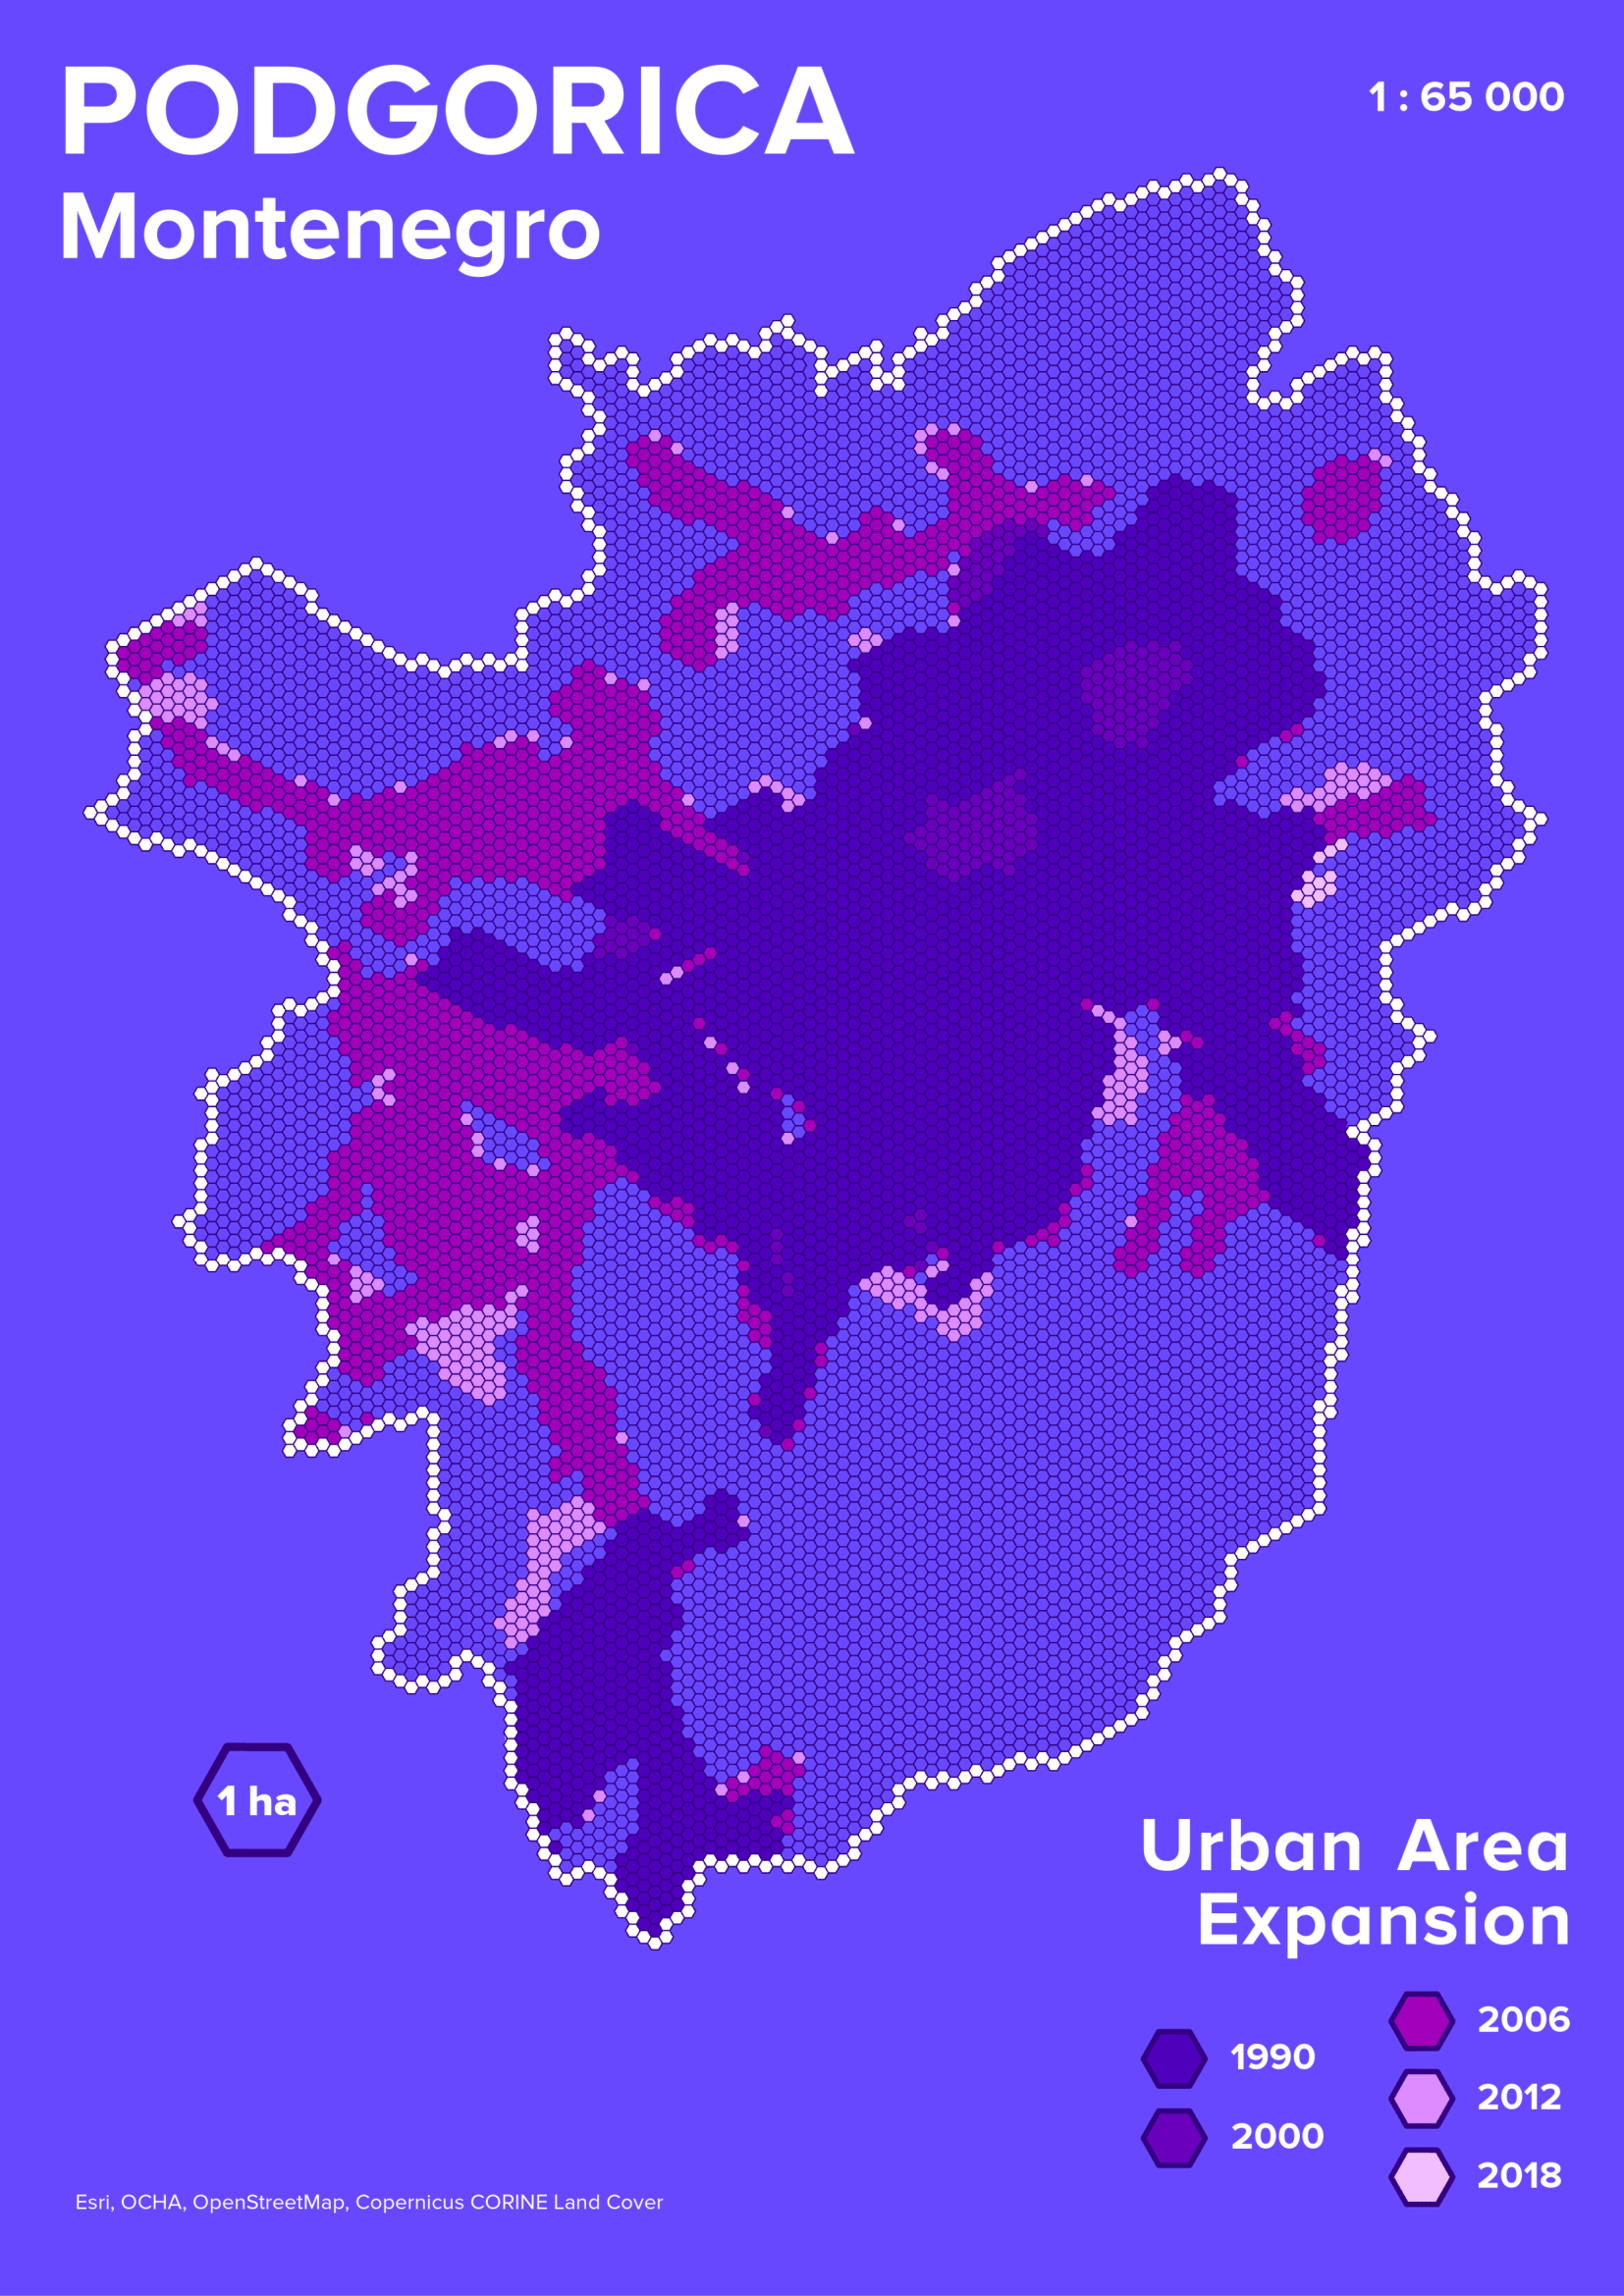
- Description: The map displays the spatial development of Montenegro’s capital over nearly three decades, from 1990 to 2018. Using shades of purple to represent different time periods, this map uses a similar hexagonal design, with each hexagon symbolizing 1 hectare of urban land.
- The darkest purple indicates land that was already urbanized by 1990. From there, the map shows steady growth through the years—2000 (medium purple), 2006 (pink), 2012 (lavender), and 2018 (pale purple). One can observe a strong and consistent expansion pattern radiating from the city’s center outward, particularly towards the south and west. Podgorica’s urban growth appears evenly distributed and gradual, suggesting steady population growth and development.